Server monitoring
Is this box healthy? Answered in the tab you are already in.
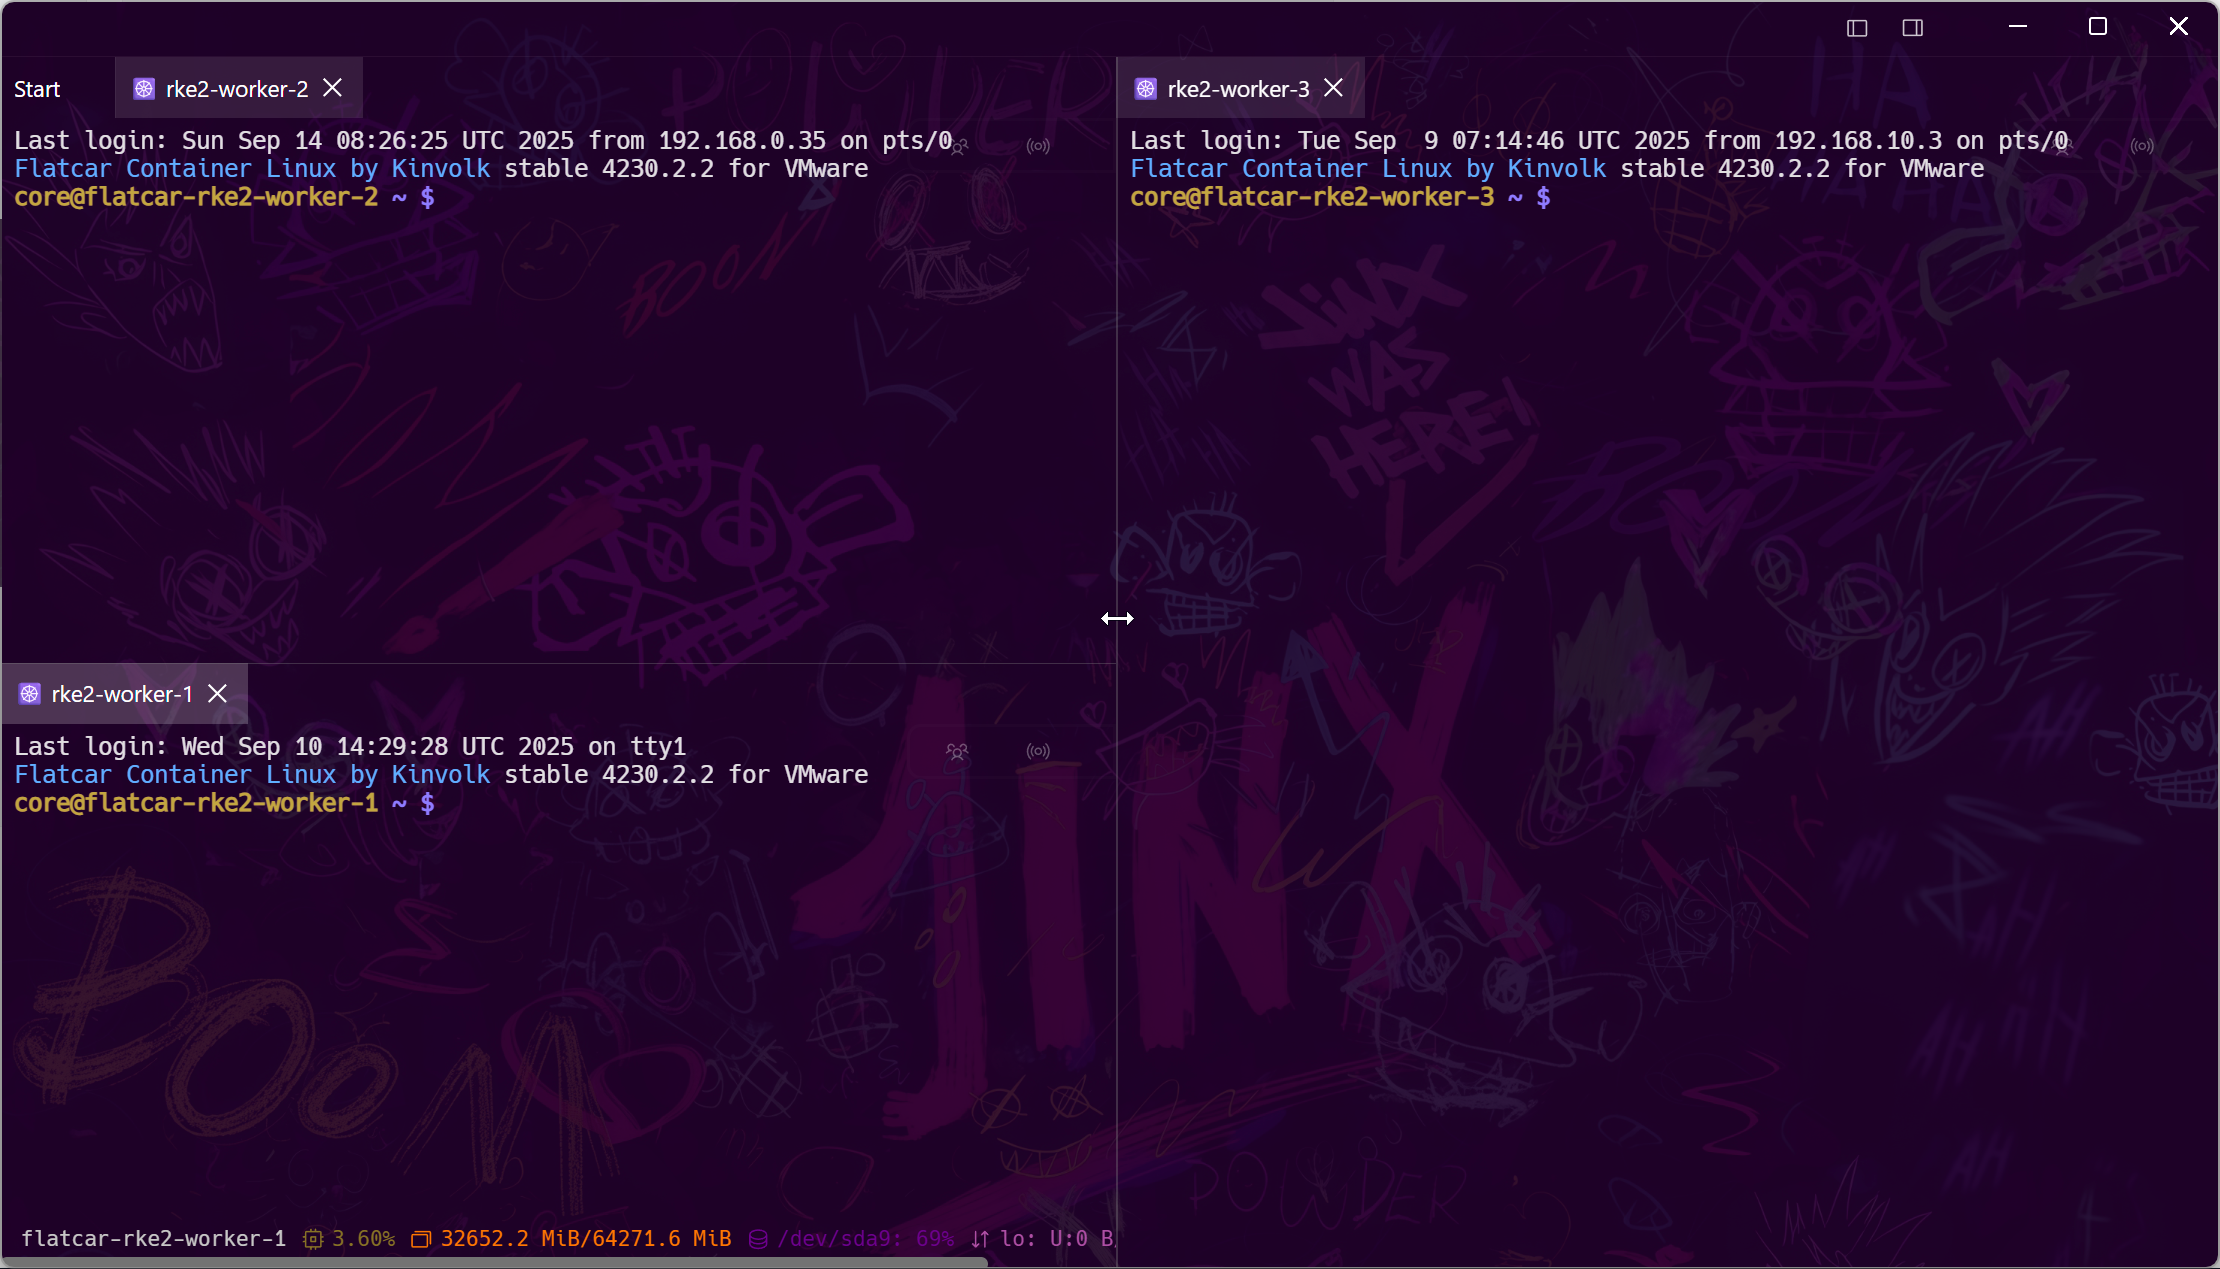
Standing up Prometheus to answer one question about one server is a week you do not have. Tempest reads the numbers with three ordinary Unix commands over the SSH session you already opened, draws them above the terminal, and never sends them anywhere.
Monitoring is a Pro feature. Linux fully supported.
No agent, no exporter
Three commands you would have run anyway
Switch monitoring on for a host and gauges appear above the terminal once the first sample lands. What runs on your server is not a mystery binary.
Being told
Scheduled checks that push to your phone
Gauges answer a question you asked. The other half is being told about the thing you were not watching.
Where alerts land
The channel your team actually watches
A notification nobody sees is not monitoring. Route them where the conversation already happens.
In the session
The numbers next to the thing causing them
A dashboard in another window makes you correlate by hand. This is above the terminal, on the same host, at the same moment.
Frequently asked questions
- Does this replace Prometheus or Grafana?
- No, and it is not trying to. There is no time-series history, no alerting rules engine and no fleet view. It answers is this box healthy right now for a server you are already connected to.
- What gets installed on my server?
- Nothing. Tempest runs top, df and cat /proc/net/dev periodically over the existing SSH session and parses the output locally.
- Does my monitoring data leave my machine?
- No. Samples are parsed on your device and rendered in your tab; they are not uploaded anywhere.
- Can I be alerted when a server goes down?
- Through a scheduled check rather than a threshold rule: a snippet that tests what you care about, on a schedule, pushing to your devices when it fails. Connection errors on critical hosts also notify.
- Is monitoring in the free plan?
- It is part of Pro, along with RDP, VNC, Kubernetes, serial, RCON and the AI agent.